Spreadsheets
[TOC]
What is a Spreadsheet?
A spreadsheet is used for organization and analysis of data in tabular form. The data is represented as cells of an array, organized in rows and columns.
Here, the Data can be filtered, and exported and we can also create charts based on it.
Spreadsheet Toolbar
The spreadsheet toolbar has useful tools to help organize the data in an easy to read format.

The buttons from left to right are as follows :
| Icon | Name | Description |
|---|---|---|
 |
Excel Export | Use this button to export the report to your computer in the Excel Spreadsheet format. Some reports will not transfer over to Excel perfectly, especially reports with pictures. |
 |
Sort Ascending | Use this button to sort the columns in the ascending order. |
 |
Sort Descending | Use this button to sort the columns in the descending order. |
 |
Filter By Selected | Use this button to apply the selected filter. |
 |
Apply / Remove Filter | Use this button to apply or remove the selected filter. |
 |
Show / Hide Filter Bar | Use this filter to show or hide the selected filter. |
 |
Show / Hide Calculator | Use this button to calculate the numerical data. |
 |
Auto Size Columns | Use this button to automatically make each column the correct width to fit all the data. |
 |
Refresh | Use this button to refresh the page. |
 |
Export Table | Use this button to export the data in your local computer. |
 |
Edit Columns | Use this filter to edit a particular column. |
Spreadsheet Shift Selector
The [Shift/Date Selector]( ) is on most spreadsheets.

For more detail on how the [Shift/Date Selector]( ) works, click [here]( )
Adding Presets
Presets are used for creating filters and charts.
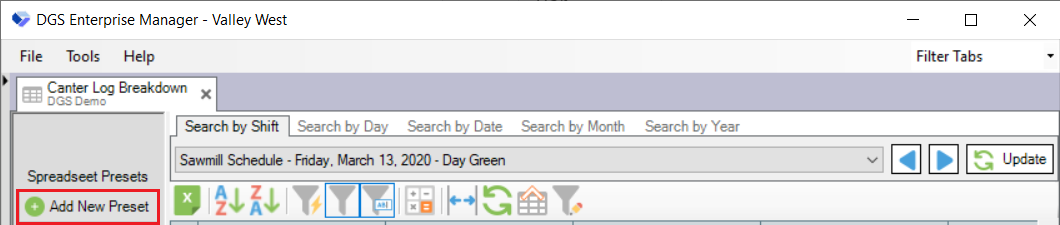
When we click on the "Add New Preset" button , we get the following page :
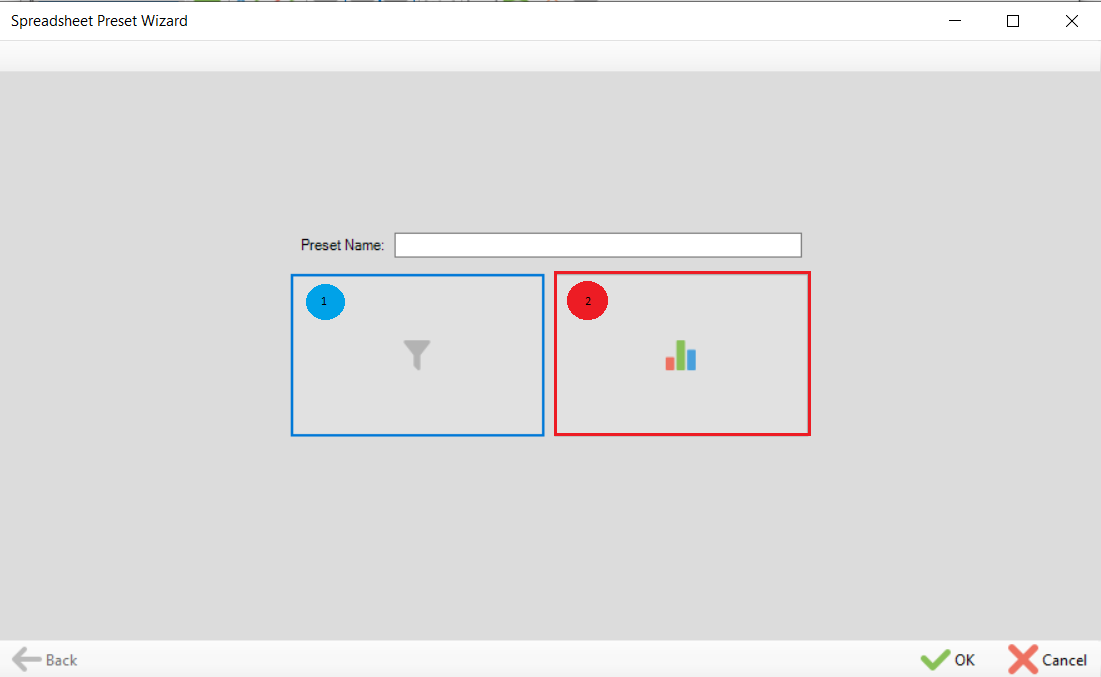
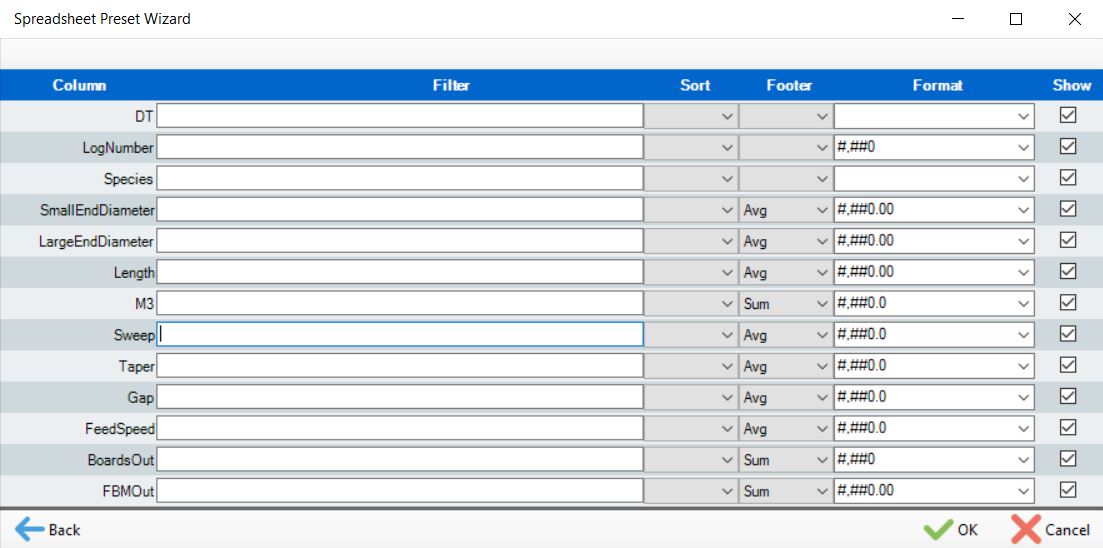
- Filters :
In the Filter section, we can filter out each column by sorting it in Ascending order or Descending Order, and aggregate function such as sum, average, minimum and maximum and format them int he way we want to see the data.
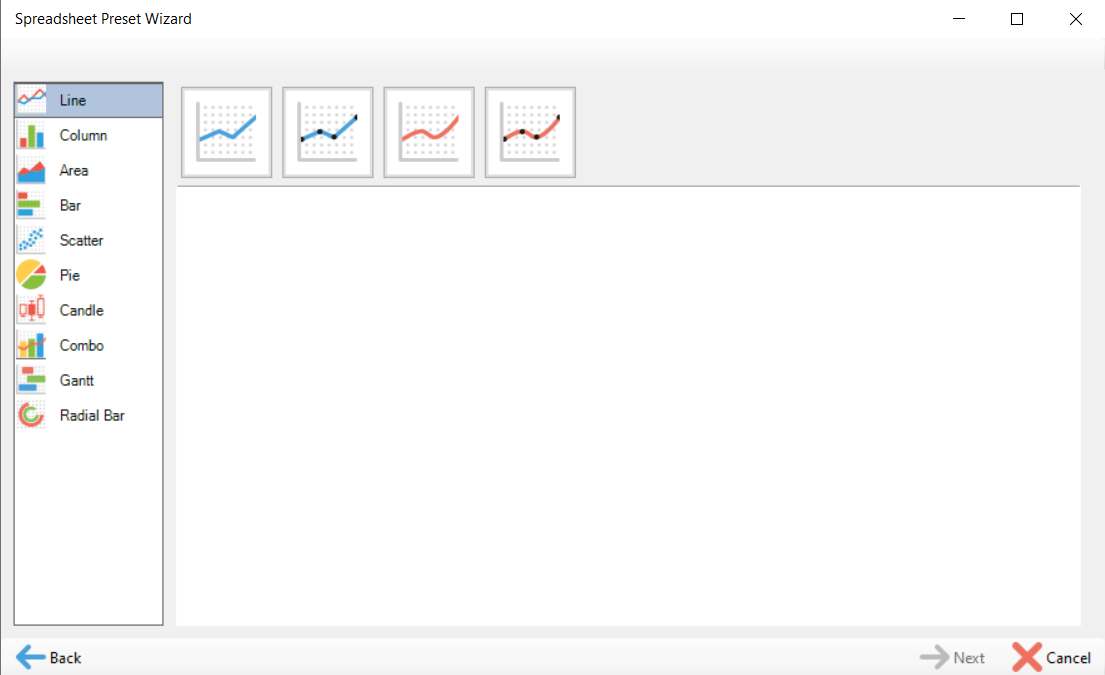
- Charts :
The sections is used to create charts, based on our data.
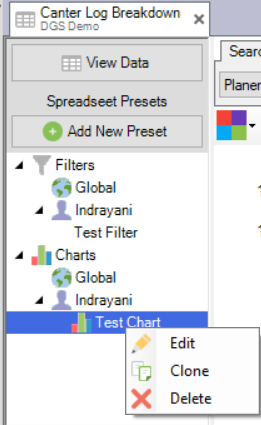
Editing Existing presets
We can edit the existing Presets by clicking right on it.