SetChartSelection
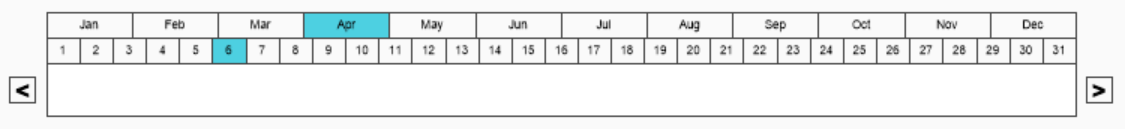
The SetChartSelection function allows the user to manually select the range and display the chart.
Syntax :
SetChartSelection(Chart,StartSelection,EndSelection)| Parameters | Description |
|---|---|
| Chart | Required, Chart name. |
| StartSelection | Minimum range. |
| EndSelection | Maximum range. |
Example :
SetChartSelection(TestChart,43837.0201,43837.0201)